
In secondary science, students often deal with big, complex ideas—think ecosystems, chemical reactions, or cell processes. Taking traditional notes sometimes isn’t enough to help them grasp these tough concepts. That’s where science graphic organizers come in. These visual tools help students break down information, organize their thoughts, and understand the relationships between ideas in a way that’s a lot easier to follow.
Here’s how using science graphic organizers for note-taking can make science lessons more engaging and effective.
Psst… There’s freebie in here somewhere!
What Exactly Are Graphic Organizers?

Graphic organizers are simple visuals that help students organize information. They can be concept maps, flowcharts, Venn diagrams, T-charts, and more. By turning written notes into diagrams, students can make sense of complex ideas and see how they’re connected.
- Concept Maps: Great for mapping out how ideas are related.
- Venn Diagrams: Perfect for comparing two or more concepts.
- Flowcharts: Ideal for showing processes or sequences, like photosynthesis or the water cycle.
- T-Charts: Good for organizing two categories, like plant vs. animal cells.
- Spider Maps: Awesome for organizing details around one main concept.
Simplify CelL ENERGY
Differentiate and provide student choice when creating notes about cellular respiration and photosynthesis.
Each of these resources includes:
- Concept Map (with word bank)
- Graphic Organizer (table-style)
- Crossword Puzzle (for practice!)


Benefits of Using SCIENCE Graphic Organizers as Notes

1. Clarify Complex Concepts
Science topics often involve systems, sequences, and relationships that can be difficult for students to conceptualize with traditional note-taking. Using a concept map, students can visualize the relationships between complex topics, making it easier to comprehend the big picture.
2. Support Different Learning Styles
Some students are visual learners, while others excel with hands-on or auditory methods. Graphic organizers appeal to multiple learning styles, allowing visual learners to benefit from the graphical nature, while kinesthetic learners can engage in the physical act of organizing and connecting information.
3. Promote Active Learning
Creating a science graphic organizer requires students to think critically about how concepts are connected. This promotes active learning, as they must engage with the material at a deeper level than traditional note-taking methods, which often involve passively copying down information.
4. Encourage Collaboration and Discussion
Graphic organizers can also serve as a collaborative tool. When students work together to create a Venn diagram comparing prokaryotic and eukaryotic cells, for example, they engage in discussion and debate, helping to reinforce their understanding through peer interaction.
5. Aid Memory and Retention
Organizing information visually makes it easier to remember. Science graphic organizers help students retain the relationships between concepts because they emphasize structure and hierarchy. For instance, using a flowchart to outline the steps of cellular respiration can help students recall the sequence of reactions involved more effectively than linear notes.
Earth Science Graphic Organizers
Both of these Earth science graphic organizers include references and background information to help students excel at making incredible notes!


How to Integrate SCIENCE Graphic Organizers into LESSONS:

1. Start with a Clear Objective
Determine the key concepts or relationships you want students to understand. Are you teaching the water cycle? The process of photosynthesis? Once you have a clear goal, you can choose a science graphic organizer that suits the lesson’s structure.
2. Model the Process
Many students may be unfamiliar with graphic organizers, so it’s important to model how to use them. Create an organizer together as a class, such as a mind map on the different types of chemical reactions (e.g., synthesis, decomposition, single replacement). This provides a template for students to follow when they create their own.
3. Make It Interactive
Use digital tools like Google Drawings, Canva, or Jamboard to allow students to create digital science graphic organizers. This makes it easy to revise and edit, and it opens the door to collaboration in online or hybrid classrooms.
4. Allow Flexibility
Encourage students to customize their science graphic organizers to reflect their understanding of the material. While you can provide templates, allowing students to create their own structures can foster deeper connections with the content. For example, when learning about the human body systems, some students may prefer a T-chart to compare functions, while others may choose a spider map to visualize the connections between systems.
5. Use Science Graphic Organizers for Assessment
Graphic organizers aren’t just for note-taking; they can also be used as assessments. Have students create a concept map to explain the flow of energy in an ecosystem, or ask them to fill out a Venn diagram comparing DNA and RNA. This allows you to evaluate their understanding of relationships and processes, rather than simple recall.


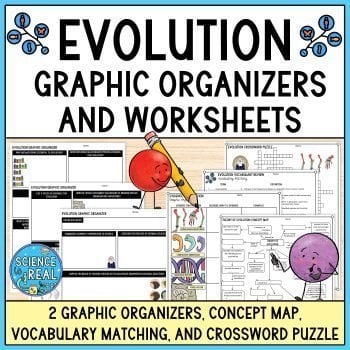
Graphic organizers are more than just another classroom tool—they are a powerful way to help students understand and retain complex scientific information. By incorporating them into your science lessons, you can promote active learning, support diverse learning needs, and help students visualize the relationships between concepts. Whether used for note-taking, collaboration, or assessment, graphic organizers can transform how students engage with science content.
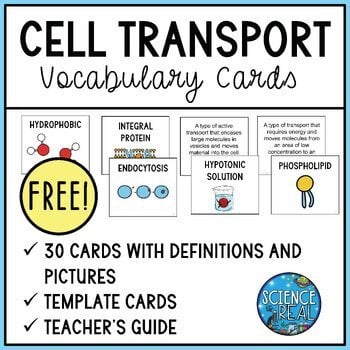
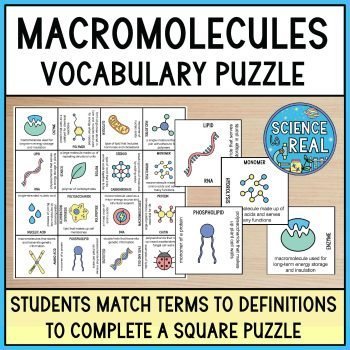
Grab a freebie on me!
This Macromolecules Vocabulary Graphic Organizer is a must-have for any high school biology teacher looking to make macromolecule review both effective and fun!
Check out my comprehensive collection of science graphic organizers in my shop or on TPT!